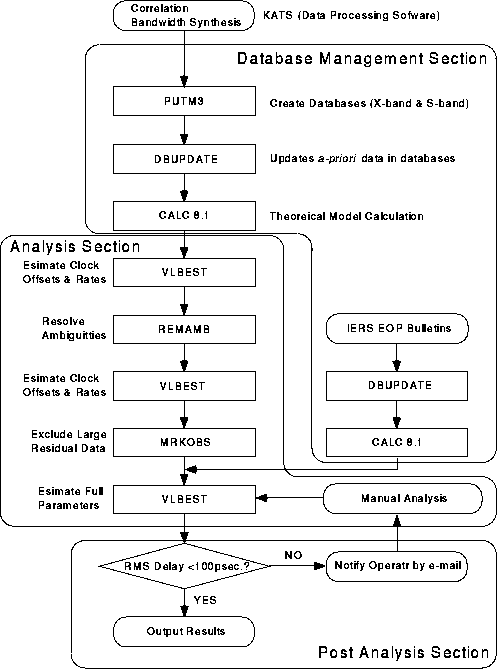
Figure 2. Flow chart of the Key Stone Project VLBI data analysis.
The software utilizes CALC (Version 8.1) and Mark-III Database Handler
software developed by Goddard Space Flight Center of National Aeronautics
and Space Administration (NASA). Since all the processed data from a
Key Stone VLBI experiments are stored in a Mark-III database, the results
can be exchanged with other institutes participating geodetic VLBI
activities worldwide. Figure 2 illustrates the data flow of the data
analysis software.

Figure 2. Flow chart of the Key Stone Project VLBI data analysis.
As soon as the bandwidth synthesis processing (KOMB) is finished on all the observations taken in a daily VLBI session, 'KOMB' output files are organized and two databases (X-band and S-band) are created from these files. S-band database is only used for correlated amplitude monitoring purposes, and on the other hand, X-band database is used for data analysis in the following steps. The X-band database is prepared for data analysis by the program DBUPDATE. DBUPDATE stores various a-priori information in the database. Next, (CALC) is executed on the X-band database to calculate theoretical delay and delay rates and their covariance matrices. At this point, the X-band database becomes ready to be analyzed by the least-square parameter adjustment program VLBEST. At first, VLBEST runs with only clock offsets and their rates of change at all stations except for a reference station. Kashima station is always chosen as the reference station whenever the station participated the session. From the results, REMAMB resolves delay ambiguities. Next, VLBEST runs again with the same sets of estimate parameters on the ambiguity-resolved data. From the results, MRKOBS flags out bad data points which have large residuals. Finally, VLBEST runs again and the full set of estimation parameters are adjusted. These parameters are: clock offsets and their rates of change at all stations except for the reference station, wet component of tropospheric delay (three hour intervals) at all stations, and site coordinates of all stations except for the reference station. Unless the root-mean-square of the residual delays exceeds a certain threshold (100 psec), the estimated results are soon released in a variety of data types and formats. If the RMS residual exceeds the threshold value, an e-mail message is sent to a responsible operator to notify the problem. The operator investigates the data closely and tries to resolve the problem. "Takemikazuchi" provides Graphical User Interface to support these tasks for the operator. The operator can remove or recover any data point, insert epoch points for tropospheric delay and clock parameters, and change the estimation strategy very easily.
In addition to the normal data analysis procedure just described above, results are revised automatically upon receipt of the weekly and monthly bulletins of the International Earth Rotation Service (IERS), i.e. Bulletins A and B respectively. This is necessary since Earth Orientation Parameters (EOP) available at the time of the first data analysis are, in fact, predicted values based on the data in past. The predictions have large uncertainties, especially the last Bulletin A is almost one week old. The uncertainties of the predictions are estimated as 3.8 mas for terrestrial pole positions and 1.5 msec for UT1-UTC at prediction length of 10 days (IERS, 1995). These uncertainties correspond to the site position estimation error of 2.0 mm and 12.0 mm respectively for the baselines with distance of 110 km, which is roughly the distance between Kashima and Koganei stations. All the e-mail messages received by the Takemikaduchi system are analyzed and the EOP data file is updated according to the Bulletin data if the e-mail was either Bulletin A or Bulletin B. Whenever the EOP data file is updated, all the affected databases are also updated and processed for data analysis. As such, the same database is repeatedly analyzed with updated EOP values at least four times (two times with Bulletin A values and two times with Bulletin B values).
            Table 1. List of experiments used for the comparison.
-------------------------------------------------------------------------------
Date of      (# of data actually used in the analysis) / (# of data correlated)
Experiments    (1) KSP Automatic     (2) KSP Manual       (3) K-3 Correlator
                   Analysis              Analysis             + SOLVE
-------------------------------------------------------------------------------
1995.12.3           58/86                 78/86                97/101
1995.12.4           61/82                 74/82                97/101
1995.12.5           79/89                 80/89                94/100
1995.12.6           78/84                 80/84                95/98
1995.12.8           71/77                 72/77                94/99
-------------------------------------------------------------------------------
To validate the results obtained by the Key Stone Project VLBI data analysis system, the estimated site position of the Koganei VLBI station was compared with the results obtained by other conventional methods. Table 1 gives the list of experiments with the number of correlated observations and actually used data for analysis. In the table, (1) and (2) are the results obtained using the KSP correlator, whereas (3) are the results obtained using the K-3 correlator. For the least-squares parameter adjustment, VLBEST was used in (1) and in (2), whereas SOLVE was used in (3). Differences between (1) and (2) are due to whether bad data are removed (1) automatically by the program MRKOBS or (2) interactively by using the Graphical User Interface.
The number of correlated observations in columns (1) and (2) are same
since they are based on the same databases. These numbers are always
less than the numbers in column (3) because there were still
miscellaneous problems during the automatic correlation processing. The
numbers of data actually used in the analysis in the column (1) are
always less than those in column (2). This is, perhaps, because the
threshold of delay residuals in the program MRKOBS is too small,
and hence some valid data are also removed from the later analysis.
Figure 3 shows the estimated site positions of Koganei VLBI station for
five experiments in the horizontal plane. Uncertainties are expressed
as one-sigma standard deviation error ellipses. Figure 4 shows the
similar comparison for the vertical axis. These comparisons do not
indicate statistically significant differences between the different
approaches of data analysis, as expected.
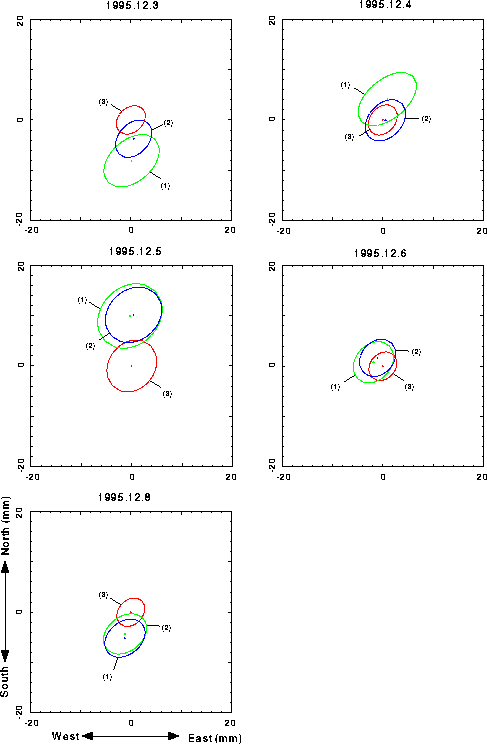
Figure 3. Estimated site position of Koganei VLBI station compared
in the horizontal plane.
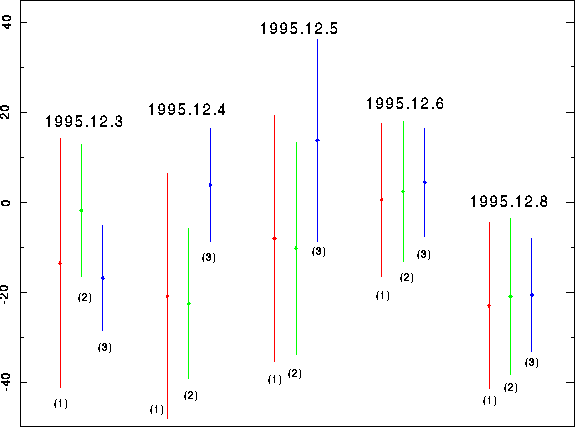
Figure 4. Estimated site position of Koganei VLBI station compared
in the vertical axis.
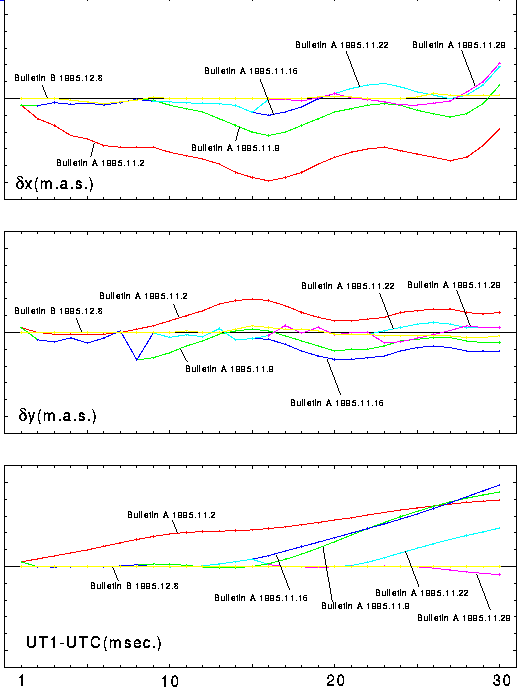
As seen in the Figure 5, the differences between predicted and
revised values increase, as the prediction is made for many days in the
future. As the EOP values are revised in the following IERS bulletins,
the values converge toward the final values. Figure 6 shows the
four different site position estimates of Koganei VLBI station compared
in the horizontal plane. Each ellipse represents a one-sigma standard
deviation uncertainty estimated using different EOP data sets.
Figure 7 compares the same results on the vertical axis.
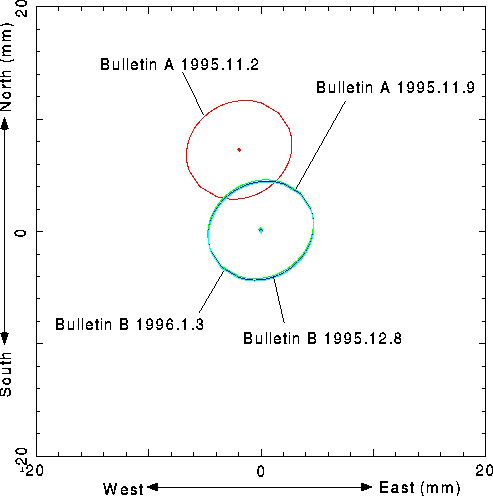
Figure 6. Estimated site position of Koganei VLBI station compared in the
horizontal plane.
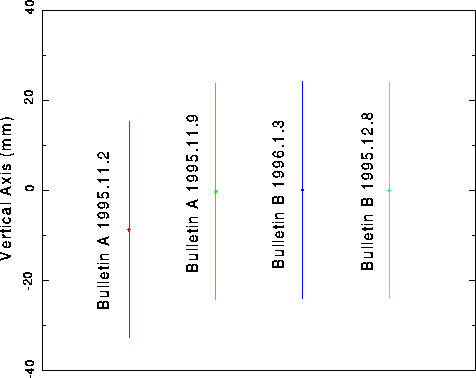
Figure 7. Estimated site position of Koganei VLBI station compared in the
vertical axis.
All the results except for the first one estimated using the predicted EOP values agree with each other. The agreement is so good that the error ellipses in the horizontal plane and error bars in the vertical axis are hardly distinguishable. On the other hand, the first results differ from the other three by about 12 mm. Since the final target of the Key Stone Project is an accuracy of 2 mm for horizontal plane and 5 mm for vertical axis, the difference of 12 mm is quite serious. Therefore, it is important to note that the site coordinates estimated right after the experiment is finished may have large systematic error due to the insufficient prediction accuracy. In the first analysis, baseline results should be used mainly. Three dimensional site coordinates are reliable from the second analysis results. It is also important to note that the results of the second analysis are in fact good enough, and such results can be obtained within a week.
The comparison of the results with other conventional results showed no significant differences. From this result, the data analysis system of the Key Stone Project is confirmed in its functionality. To prevent unnecessarily removal of valid data, the algorithm of MRKOBS should be improved.
The effects of prediction uncertainties of Earth Orientation Parameters were also examined. The results indicated that the three dimensional site coordinates estimated in the first data analysis needs to be used cautiously. When high accuracy and reliability of the results are required, as in the case of the Key Stone Project, only the baseline lengths after the initial analysis, or the complete results after the second analysis should be used.