ats1
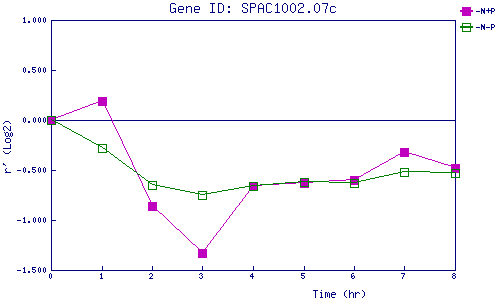
| 0 | 1 | 2 | 3 | 4 | 5 | 6 | 7 | 8 | |
| -N+P | 0.000 | 0.189 | -0.856 | -1.331 | -0.658 | -0.626 | -0.604 | -0.315 | -0.482 |
| -N-P | 0.000 | -0.284 | -0.651 | -0.751 | -0.665 | -0.620 | -0.629 | -0.515 | -0.532 |
|
-N+P: Nitrogen starved in the presence of P-factor -N-P: Nitrogen starved in the absence of P-factor |