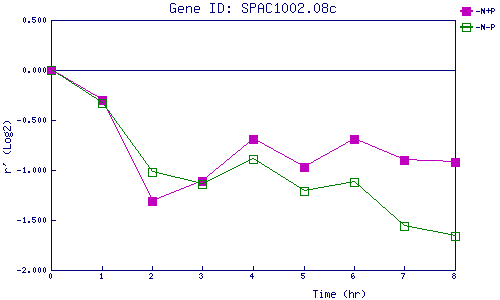
| 0 | 1 | 2 | 3 | 4 | 5 | 6 | 7 | 8 | |
| -N+P | 0.000 | -0.302 | -1.306 | -1.108 | -0.693 | -0.968 | -0.692 | -0.895 | -0.923 |
| -N-P | 0.000 | -0.328 | -1.022 | -1.144 | -0.889 | -1.212 | -1.124 | -1.555 | -1.662 |
|
-N+P: Nitrogen starved in the presence of P-factor -N-P: Nitrogen starved in the absence of P-factor |