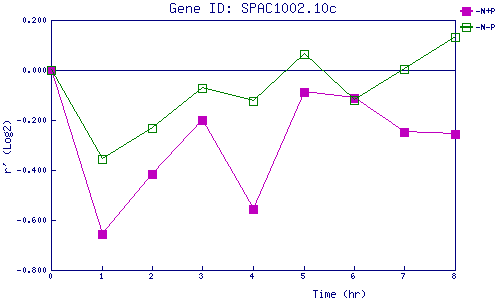
| 0 | 1 | 2 | 3 | 4 | 5 | 6 | 7 | 8 | |
| -N+P | 0.000 | -0.654 | -0.418 | -0.198 | -0.555 | -0.089 | -0.113 | -0.246 | -0.256 |
| -N-P | 0.000 | -0.355 | -0.233 | -0.074 | -0.124 | 0.064 | -0.122 | 0.004 | 0.132 |
|
-N+P: Nitrogen starved in the presence of P-factor -N-P: Nitrogen starved in the absence of P-factor |