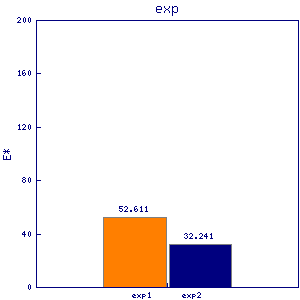
psu1
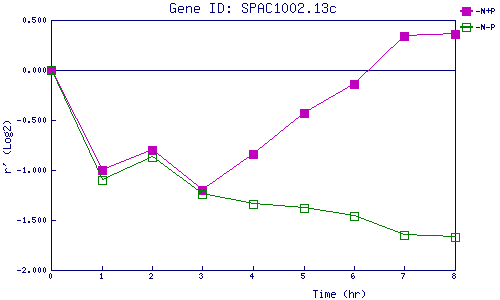
| 0 | 1 | 2 | 3 | 4 | 5 | 6 | 7 | 8 | |
| -N+P | 0.000 | -1.002 | -0.799 | -1.204 | -0.841 | -0.428 | -0.141 | 0.341 | 0.355 |
| -N-P | 0.000 | -1.101 | -0.869 | -1.238 | -1.343 | -1.377 | -1.456 | -1.646 | -1.673 |
|
-N+P: Nitrogen starved in the presence of P-factor -N-P: Nitrogen starved in the absence of P-factor |