itt1
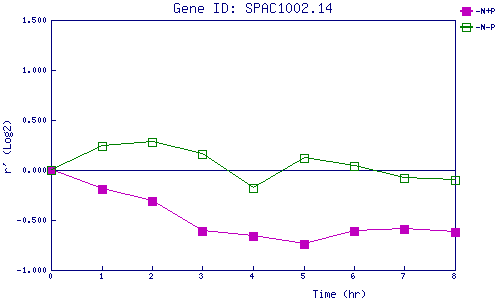
| 0 | 1 | 2 | 3 | 4 | 5 | 6 | 7 | 8 | |
| -N+P | 0.000 | -0.186 | -0.311 | -0.606 | -0.658 | -0.743 | -0.606 | -0.593 | -0.623 |
| -N-P | 0.000 | 0.245 | 0.275 | 0.159 | -0.180 | 0.122 | 0.036 | -0.075 | -0.097 |
|
-N+P: Nitrogen starved in the presence of P-factor -N-P: Nitrogen starved in the absence of P-factor |