pmc5
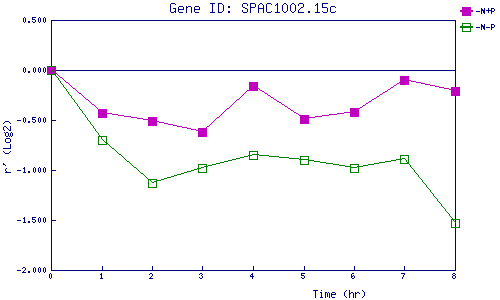
| 0 | 1 | 2 | 3 | 4 | 5 | 6 | 7 | 8 | |
| -N+P | 0.000 | -0.434 | -0.513 | -0.617 | -0.165 | -0.493 | -0.421 | -0.095 | -0.208 |
| -N-P | 0.000 | -0.703 | -1.129 | -0.980 | -0.846 | -0.897 | -0.979 | -0.889 | -1.526 |
|
-N+P: Nitrogen starved in the presence of P-factor -N-P: Nitrogen starved in the absence of P-factor |