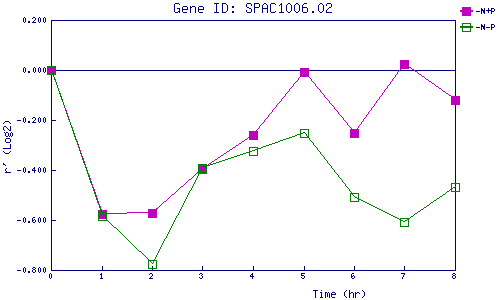
| 0 | 1 | 2 | 3 | 4 | 5 | 6 | 7 | 8 | |
| -N+P | 0.000 | -0.577 | -0.573 | -0.396 | -0.261 | -0.006 | -0.251 | 0.022 | -0.119 |
| -N-P | 0.000 | -0.585 | -0.777 | -0.393 | -0.323 | -0.251 | -0.509 | -0.610 | -0.469 |
|
-N+P: Nitrogen starved in the presence of P-factor -N-P: Nitrogen starved in the absence of P-factor |