| 0 | 1 | 2 | 3 | 4 | 5 | 6 | 7 | 8 | |
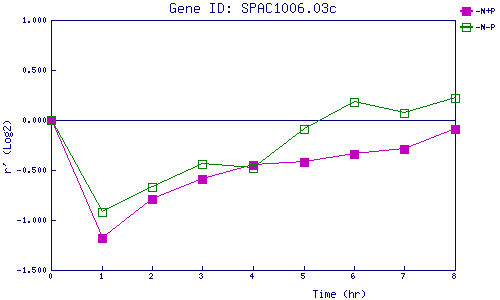
| -N+P | 0.000 | -1.182 | -0.792 | -0.592 | -0.453 | -0.422 | -0.342 | -0.290 | -0.086 |
| -N-P | 0.000 | -0.925 | -0.673 | -0.439 | -0.478 | -0.089 | 0.176 | 0.071 | 0.216 |
|
-N+P: Nitrogen starved in the presence of P-factor -N-P: Nitrogen starved in the absence of P-factor |