reserved_name_rgf2
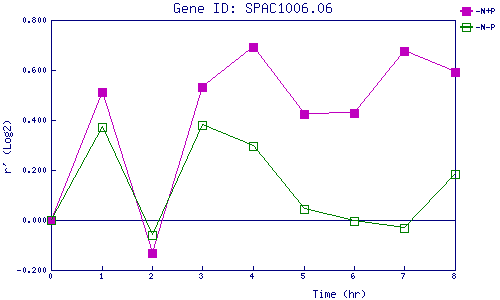
| 0 | 1 | 2 | 3 | 4 | 5 | 6 | 7 | 8 | |
| -N+P | 0.000 | 0.511 | -0.133 | 0.532 | 0.692 | 0.424 | 0.428 | 0.676 | 0.593 |
| -N-P | 0.000 | 0.373 | -0.059 | 0.379 | 0.297 | 0.044 | -0.003 | -0.030 | 0.186 |
|
-N+P: Nitrogen starved in the presence of P-factor -N-P: Nitrogen starved in the absence of P-factor |