tif1
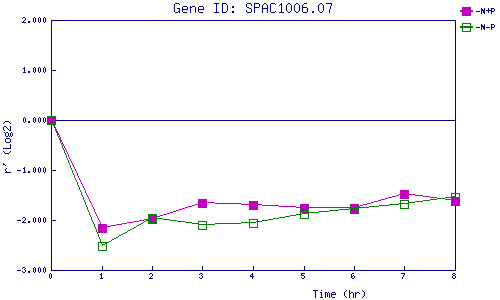
| 0 | 1 | 2 | 3 | 4 | 5 | 6 | 7 | 8 | |
| -N+P | 0.000 | -2.161 | -1.978 | -1.654 | -1.704 | -1.754 | -1.754 | -1.471 | -1.614 |
| -N-P | 0.000 | -2.521 | -1.964 | -2.098 | -2.068 | -1.888 | -1.779 | -1.681 | -1.538 |
|
-N+P: Nitrogen starved in the presence of P-factor -N-P: Nitrogen starved in the absence of P-factor |