etd1
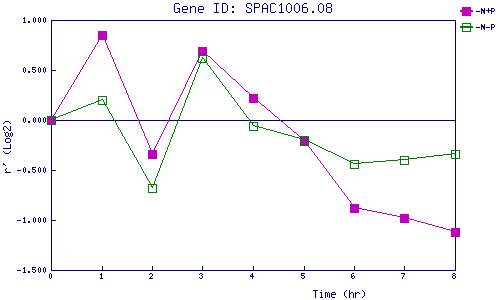
| 0 | 1 | 2 | 3 | 4 | 5 | 6 | 7 | 8 | |
| -N+P | 0.000 | 0.849 | -0.338 | 0.693 | 0.217 | -0.207 | -0.883 | -0.975 | -1.123 |
| -N-P | 0.000 | 0.200 | -0.682 | 0.618 | -0.061 | -0.201 | -0.445 | -0.400 | -0.340 |
|
-N+P: Nitrogen starved in the presence of P-factor -N-P: Nitrogen starved in the absence of P-factor |