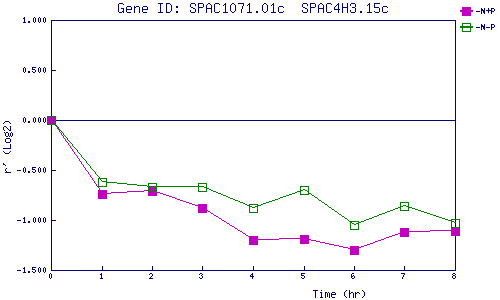
| 0 | 1 | 2 | 3 | 4 | 5 | 6 | 7 | 8 | |
| -N+P | 0.000 | -0.739 | -0.707 | -0.876 | -1.203 | -1.187 | -1.296 | -1.115 | -1.113 |
| -N-P | 0.000 | -0.617 | -0.668 | -0.671 | -0.875 | -0.702 | -1.051 | -0.861 | -1.028 |
|
-N+P: Nitrogen starved in the presence of P-factor -N-P: Nitrogen starved in the absence of P-factor |