| 0 | 1 | 2 | 3 | 4 | 5 | 6 | 7 | 8 | |
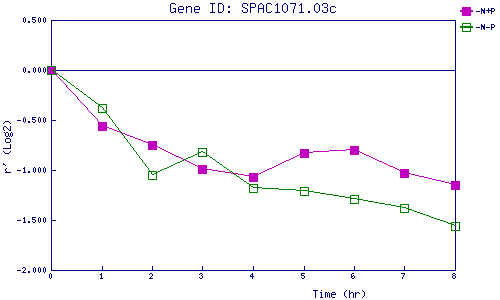
| -N+P | 0.000 | -0.564 | -0.748 | -0.989 | -1.067 | -0.832 | -0.802 | -1.033 | -1.148 |
| -N-P | 0.000 | -0.379 | -1.046 | -0.824 | -1.175 | -1.208 | -1.292 | -1.382 | -1.562 |
|
-N+P: Nitrogen starved in the presence of P-factor -N-P: Nitrogen starved in the absence of P-factor |