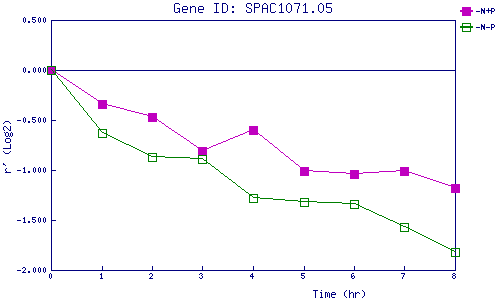
| 0 | 1 | 2 | 3 | 4 | 5 | 6 | 7 | 8 | |
| -N+P | 0.000 | -0.341 | -0.470 | -0.812 | -0.605 | -1.013 | -1.044 | -1.011 | -1.177 |
| -N-P | 0.000 | -0.630 | -0.868 | -0.886 | -1.281 | -1.317 | -1.343 | -1.570 | -1.820 |
|
-N+P: Nitrogen starved in the presence of P-factor -N-P: Nitrogen starved in the absence of P-factor |