rpp203 rpp2-3 rla6
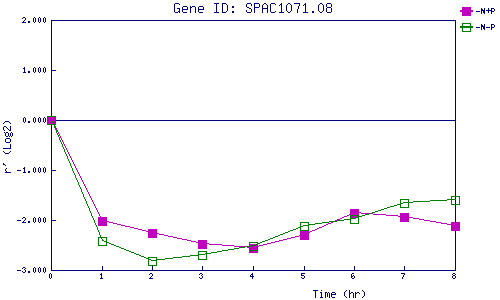
| 0 | 1 | 2 | 3 | 4 | 5 | 6 | 7 | 8 | |
| -N+P | 0.000 | -2.012 | -2.265 | -2.489 | -2.561 | -2.302 | -1.858 | -1.940 | -2.117 |
| -N-P | 0.000 | -2.413 | -2.816 | -2.705 | -2.525 | -2.111 | -1.973 | -1.665 | -1.610 |
|
-N+P: Nitrogen starved in the presence of P-factor -N-P: Nitrogen starved in the absence of P-factor |