pma1
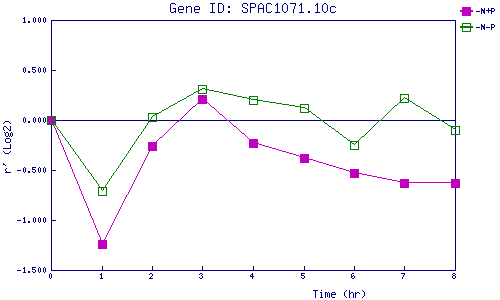
| 0 | 1 | 2 | 3 | 4 | 5 | 6 | 7 | 8 | |
| -N+P | 0.000 | -1.239 | -0.255 | 0.211 | -0.232 | -0.384 | -0.529 | -0.631 | -0.626 |
| -N-P | 0.000 | -0.713 | 0.028 | 0.310 | 0.195 | 0.117 | -0.252 | 0.221 | -0.099 |
|
-N+P: Nitrogen starved in the presence of P-factor -N-P: Nitrogen starved in the absence of P-factor |