stp1
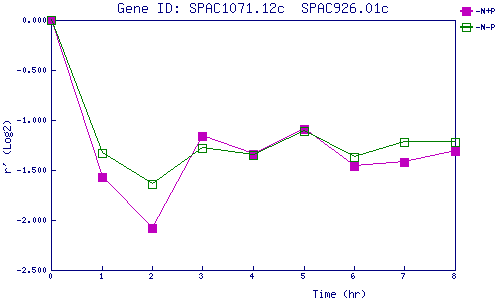
| 0 | 1 | 2 | 3 | 4 | 5 | 6 | 7 | 8 | |
| -N+P | 0.000 | -1.569 | -2.085 | -1.161 | -1.342 | -1.087 | -1.458 | -1.418 | -1.310 |
| -N-P | 0.000 | -1.330 | -1.639 | -1.285 | -1.350 | -1.108 | -1.374 | -1.225 | -1.216 |
|
-N+P: Nitrogen starved in the presence of P-factor -N-P: Nitrogen starved in the absence of P-factor |