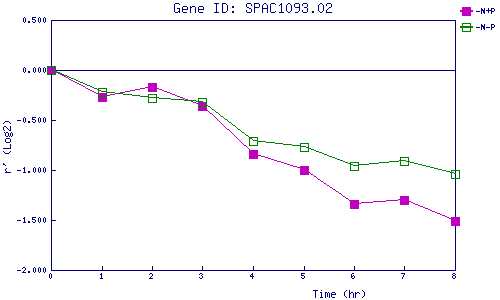
| 0 | 1 | 2 | 3 | 4 | 5 | 6 | 7 | 8 | |
| -N+P | 0.000 | -0.266 | -0.171 | -0.358 | -0.842 | -1.001 | -1.338 | -1.302 | -1.509 |
| -N-P | 0.000 | -0.219 | -0.281 | -0.325 | -0.708 | -0.773 | -0.964 | -0.909 | -1.044 |
|
-N+P: Nitrogen starved in the presence of P-factor -N-P: Nitrogen starved in the absence of P-factor |