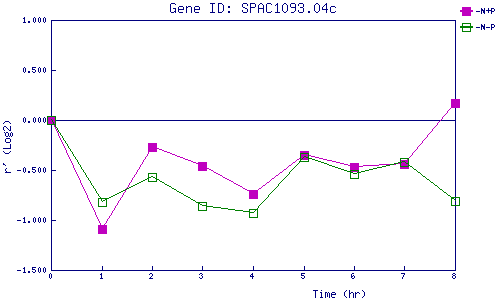
| 0 | 1 | 2 | 3 | 4 | 5 | 6 | 7 | 8 | |
| -N+P | 0.000 | -1.094 | -0.272 | -0.463 | -0.745 | -0.354 | -0.470 | -0.443 | 0.174 |
| -N-P | 0.000 | -0.815 | -0.572 | -0.863 | -0.934 | -0.370 | -0.535 | -0.418 | -0.807 |
|
-N+P: Nitrogen starved in the presence of P-factor -N-P: Nitrogen starved in the absence of P-factor |