| 0 | 1 | 2 | 3 | 4 | 5 | 6 | 7 | 8 | |
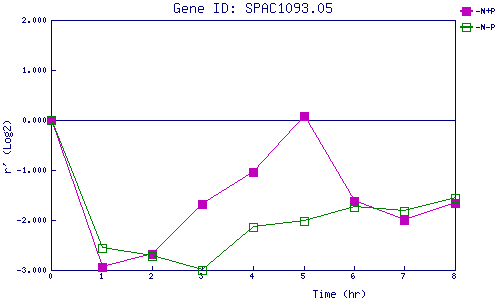
| -N+P | 0.000 | -2.947 | -2.681 | -1.671 | -1.033 | 0.076 | -1.628 | -1.994 | -1.660 |
| -N-P | 0.000 | -2.568 | -2.713 | -2.999 | -2.131 | -2.026 | -1.738 | -1.815 | -1.567 |
|
-N+P: Nitrogen starved in the presence of P-factor -N-P: Nitrogen starved in the absence of P-factor |