| 0 | 1 | 2 | 3 | 4 | 5 | 6 | 7 | 8 | |
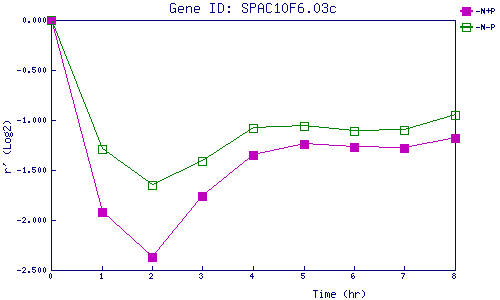
| -N+P | 0.000 | -1.920 | -2.369 | -1.763 | -1.346 | -1.241 | -1.269 | -1.280 | -1.185 |
| -N-P | 0.000 | -1.288 | -1.654 | -1.414 | -1.085 | -1.061 | -1.107 | -1.096 | -0.952 |
|
-N+P: Nitrogen starved in the presence of P-factor -N-P: Nitrogen starved in the absence of P-factor |