ubc6
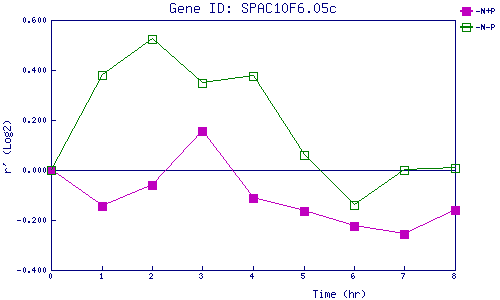
| 0 | 1 | 2 | 3 | 4 | 5 | 6 | 7 | 8 | |
| -N+P | 0.000 | -0.146 | -0.060 | 0.157 | -0.110 | -0.165 | -0.226 | -0.257 | -0.158 |
| -N-P | 0.000 | 0.379 | 0.523 | 0.349 | 0.377 | 0.059 | -0.139 | 0.002 | 0.008 |
|
-N+P: Nitrogen starved in the presence of P-factor -N-P: Nitrogen starved in the absence of P-factor |