| 0 | 1 | 2 | 3 | 4 | 5 | 6 | 7 | 8 | |
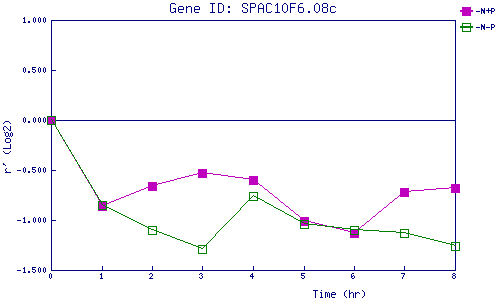
| -N+P | 0.000 | -0.855 | -0.664 | -0.534 | -0.595 | -1.013 | -1.130 | -0.723 | -0.676 |
| -N-P | 0.000 | -0.850 | -1.098 | -1.291 | -0.756 | -1.038 | -1.098 | -1.133 | -1.258 |
|
-N+P: Nitrogen starved in the presence of P-factor -N-P: Nitrogen starved in the absence of P-factor |