| 0 | 1 | 2 | 3 | 4 | 5 | 6 | 7 | 8 | |
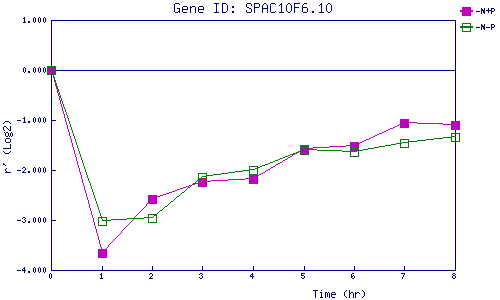
| -N+P | 0.000 | -3.660 | -2.578 | -2.246 | -2.185 | -1.583 | -1.515 | -1.062 | -1.096 |
| -N-P | 0.000 | -3.016 | -2.962 | -2.142 | -1.994 | -1.603 | -1.637 | -1.456 | -1.339 |
|
-N+P: Nitrogen starved in the presence of P-factor -N-P: Nitrogen starved in the absence of P-factor |