Sp-Z16-sno
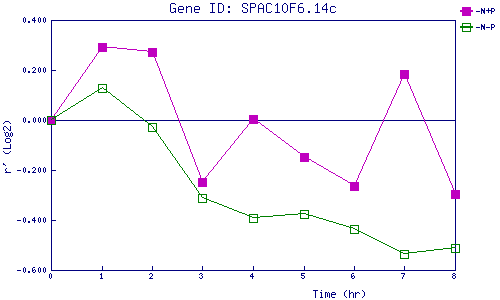
| 0 | 1 | 2 | 3 | 4 | 5 | 6 | 7 | 8 | |
| -N+P | 0.000 | 0.291 | 0.270 | -0.249 | 0.005 | -0.148 | -0.262 | 0.185 | -0.298 |
| -N-P | 0.000 | 0.128 | -0.029 | -0.312 | -0.394 | -0.376 | -0.436 | -0.537 | -0.510 |
|
-N+P: Nitrogen starved in the presence of P-factor -N-P: Nitrogen starved in the absence of P-factor |