pds5
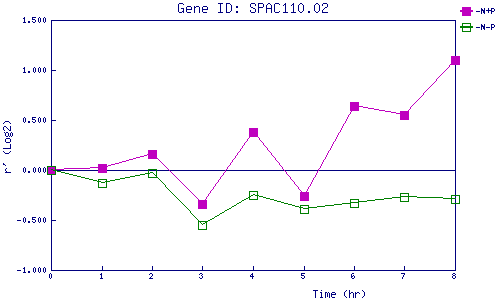
| 0 | 1 | 2 | 3 | 4 | 5 | 6 | 7 | 8 | |
| -N+P | 0.000 | 0.016 | 0.163 | -0.345 | 0.379 | -0.262 | 0.640 | 0.547 | 1.096 |
| -N-P | 0.000 | -0.129 | -0.032 | -0.547 | -0.247 | -0.387 | -0.332 | -0.274 | -0.293 |
|
-N+P: Nitrogen starved in the presence of P-factor -N-P: Nitrogen starved in the absence of P-factor |