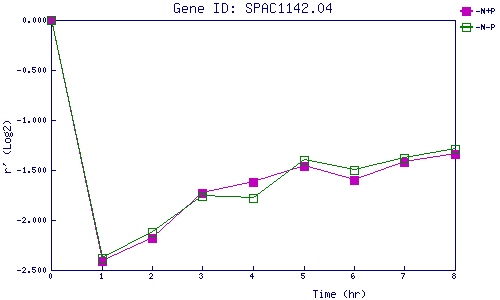
| 0 | 1 | 2 | 3 | 4 | 5 | 6 | 7 | 8 | |
| -N+P | 0.000 | -2.410 | -2.178 | -1.728 | -1.617 | -1.455 | -1.601 | -1.415 | -1.340 |
| -N-P | 0.000 | -2.383 | -2.121 | -1.756 | -1.782 | -1.402 | -1.501 | -1.376 | -1.289 |
|
-N+P: Nitrogen starved in the presence of P-factor -N-P: Nitrogen starved in the absence of P-factor |