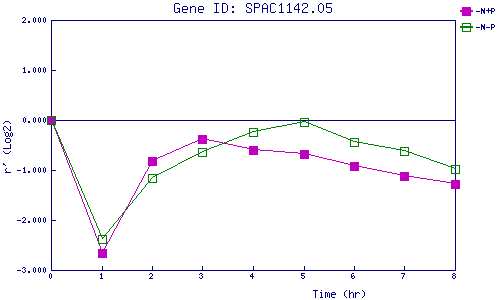
| 0 | 1 | 2 | 3 | 4 | 5 | 6 | 7 | 8 | |
| -N+P | 0.000 | -2.665 | -0.823 | -0.374 | -0.603 | -0.674 | -0.914 | -1.125 | -1.276 |
| -N-P | 0.000 | -2.388 | -1.159 | -0.631 | -0.242 | -0.030 | -0.442 | -0.628 | -0.973 |
|
-N+P: Nitrogen starved in the presence of P-factor -N-P: Nitrogen starved in the absence of P-factor |