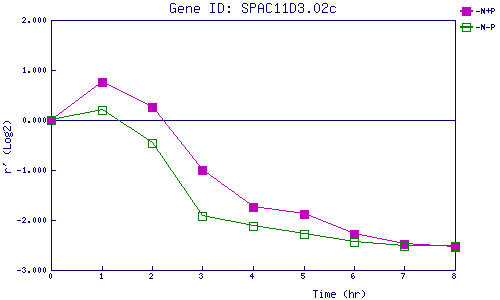
| 0 | 1 | 2 | 3 | 4 | 5 | 6 | 7 | 8 | |
| -N+P | 0.000 | 0.750 | 0.251 | -1.008 | -1.736 | -1.880 | -2.278 | -2.488 | -2.532 |
| -N-P | 0.000 | 0.206 | -0.469 | -1.926 | -2.130 | -2.277 | -2.442 | -2.525 | -2.520 |
|
-N+P: Nitrogen starved in the presence of P-factor -N-P: Nitrogen starved in the absence of P-factor |