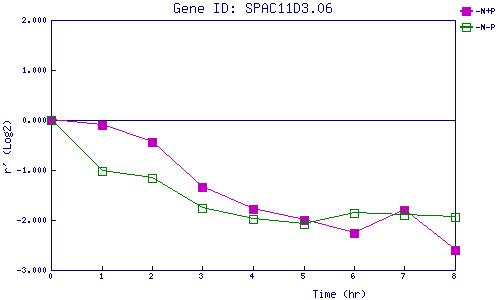
| 0 | 1 | 2 | 3 | 4 | 5 | 6 | 7 | 8 | |
| -N+P | 0.000 | -0.091 | -0.431 | -1.346 | -1.785 | -2.009 | -2.262 | -1.800 | -2.602 |
| -N-P | 0.000 | -1.021 | -1.157 | -1.760 | -1.974 | -2.088 | -1.865 | -1.903 | -1.932 |
|
-N+P: Nitrogen starved in the presence of P-factor -N-P: Nitrogen starved in the absence of P-factor |