| 0 | 1 | 2 | 3 | 4 | 5 | 6 | 7 | 8 | |
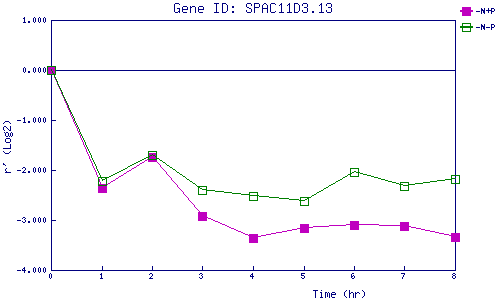
| -N+P | 0.000 | -2.359 | -1.735 | -2.926 | -3.358 | -3.167 | -3.092 | -3.126 | -3.340 |
| -N-P | 0.000 | -2.211 | -1.692 | -2.403 | -2.530 | -2.622 | -2.039 | -2.311 | -2.178 |
|
-N+P: Nitrogen starved in the presence of P-factor -N-P: Nitrogen starved in the absence of P-factor |