pcs1
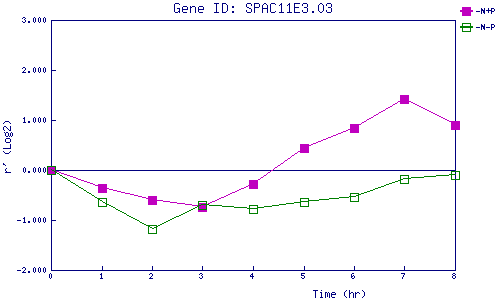
| 0 | 1 | 2 | 3 | 4 | 5 | 6 | 7 | 8 | |
| -N+P | 0.000 | -0.353 | -0.596 | -0.739 | -0.276 | 0.431 | 0.837 | 1.425 | 0.892 |
| -N-P | 0.000 | -0.640 | -1.186 | -0.704 | -0.781 | -0.638 | -0.531 | -0.177 | -0.107 |
|
-N+P: Nitrogen starved in the presence of P-factor -N-P: Nitrogen starved in the absence of P-factor |