cor1
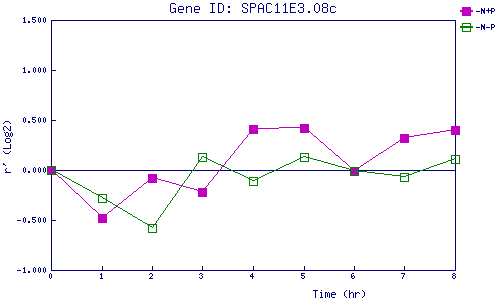
| 0 | 1 | 2 | 3 | 4 | 5 | 6 | 7 | 8 | |
| -N+P | 0.000 | -0.475 | -0.078 | -0.224 | 0.407 | 0.423 | -0.011 | 0.325 | 0.401 |
| -N-P | 0.000 | -0.282 | -0.580 | 0.129 | -0.106 | 0.127 | -0.006 | -0.067 | 0.111 |
|
-N+P: Nitrogen starved in the presence of P-factor -N-P: Nitrogen starved in the absence of P-factor |