pyp3
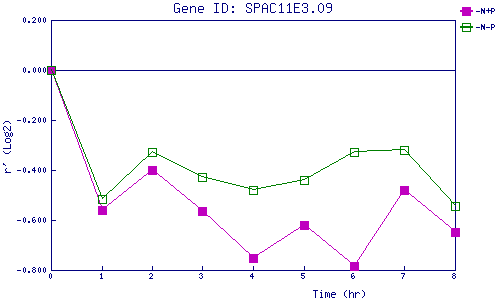
| 0 | 1 | 2 | 3 | 4 | 5 | 6 | 7 | 8 | |
| -N+P | 0.000 | -0.561 | -0.400 | -0.563 | -0.751 | -0.619 | -0.785 | -0.479 | -0.646 |
| -N-P | 0.000 | -0.517 | -0.329 | -0.427 | -0.482 | -0.440 | -0.328 | -0.322 | -0.542 |
|
-N+P: Nitrogen starved in the presence of P-factor -N-P: Nitrogen starved in the absence of P-factor |