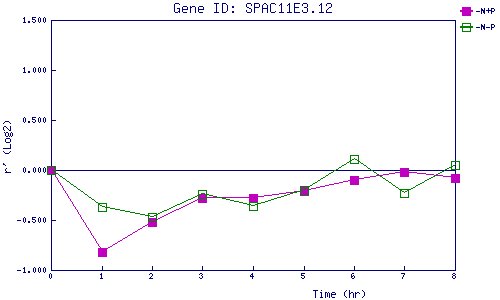
| 0 | 1 | 2 | 3 | 4 | 5 | 6 | 7 | 8 | |
| -N+P | 0.000 | -0.818 | -0.524 | -0.277 | -0.277 | -0.206 | -0.097 | -0.019 | -0.075 |
| -N-P | 0.000 | -0.370 | -0.471 | -0.236 | -0.356 | -0.198 | 0.110 | -0.228 | 0.049 |
|
-N+P: Nitrogen starved in the presence of P-factor -N-P: Nitrogen starved in the absence of P-factor |