| 0 | 1 | 2 | 3 | 4 | 5 | 6 | 7 | 8 | |
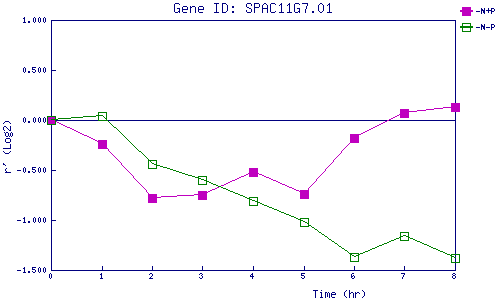
| -N+P | 0.000 | -0.239 | -0.780 | -0.747 | -0.516 | -0.736 | -0.177 | 0.070 | 0.134 |
| -N-P | 0.000 | 0.035 | -0.437 | -0.600 | -0.811 | -1.016 | -1.371 | -1.158 | -1.378 |
|
-N+P: Nitrogen starved in the presence of P-factor -N-P: Nitrogen starved in the absence of P-factor |