idh1 glu3
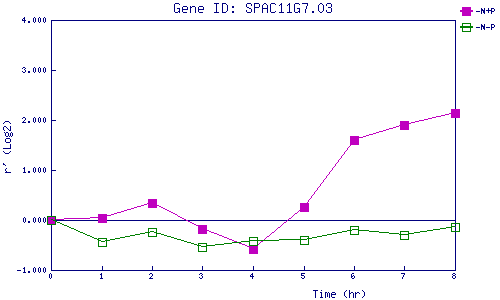
| 0 | 1 | 2 | 3 | 4 | 5 | 6 | 7 | 8 | |
| -N+P | 0.000 | 0.045 | 0.341 | -0.180 | -0.588 | 0.264 | 1.597 | 1.901 | 2.139 |
| -N-P | 0.000 | -0.449 | -0.249 | -0.539 | -0.421 | -0.407 | -0.200 | -0.293 | -0.137 |
|
-N+P: Nitrogen starved in the presence of P-factor -N-P: Nitrogen starved in the absence of P-factor |