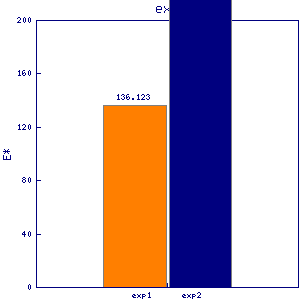
ubi1
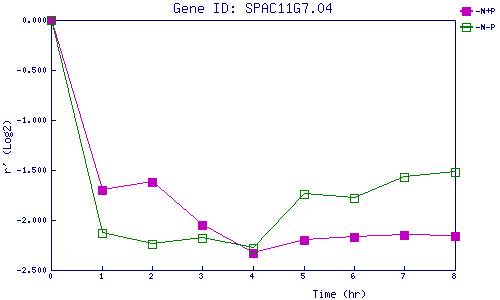
| 0 | 1 | 2 | 3 | 4 | 5 | 6 | 7 | 8 | |
| -N+P | 0.000 | -1.698 | -1.620 | -2.051 | -2.334 | -2.202 | -2.173 | -2.148 | -2.157 |
| -N-P | 0.000 | -2.129 | -2.244 | -2.184 | -2.283 | -1.745 | -1.782 | -1.569 | -1.524 |
|
-N+P: Nitrogen starved in the presence of P-factor -N-P: Nitrogen starved in the absence of P-factor |