| 0 | 1 | 2 | 3 | 4 | 5 | 6 | 7 | 8 | |
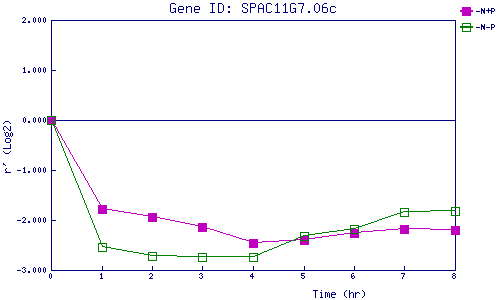
| -N+P | 0.000 | -1.771 | -1.949 | -2.143 | -2.464 | -2.405 | -2.264 | -2.178 | -2.194 |
| -N-P | 0.000 | -2.543 | -2.726 | -2.733 | -2.741 | -2.316 | -2.174 | -1.846 | -1.817 |
|
-N+P: Nitrogen starved in the presence of P-factor -N-P: Nitrogen starved in the absence of P-factor |