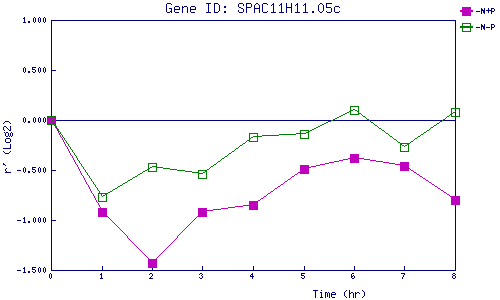
| 0 | 1 | 2 | 3 | 4 | 5 | 6 | 7 | 8 | |
| -N+P | 0.000 | -0.922 | -1.432 | -0.917 | -0.848 | -0.493 | -0.378 | -0.459 | -0.797 |
| -N-P | 0.000 | -0.771 | -0.468 | -0.544 | -0.167 | -0.135 | 0.101 | -0.273 | 0.075 |
|
-N+P: Nitrogen starved in the presence of P-factor -N-P: Nitrogen starved in the absence of P-factor |