ubc14
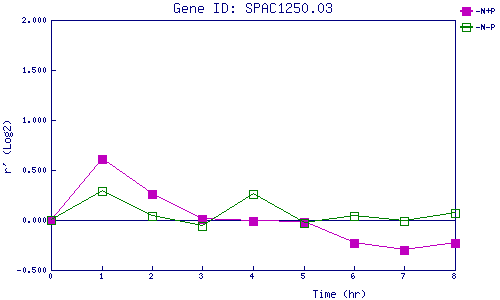
| 0 | 1 | 2 | 3 | 4 | 5 | 6 | 7 | 8 | |
| -N+P | 0.000 | 0.607 | 0.260 | 0.007 | -0.008 | -0.019 | -0.230 | -0.304 | -0.233 |
| -N-P | 0.000 | 0.290 | 0.038 | -0.060 | 0.262 | -0.029 | 0.045 | -0.010 | 0.074 |
|
-N+P: Nitrogen starved in the presence of P-factor -N-P: Nitrogen starved in the absence of P-factor |