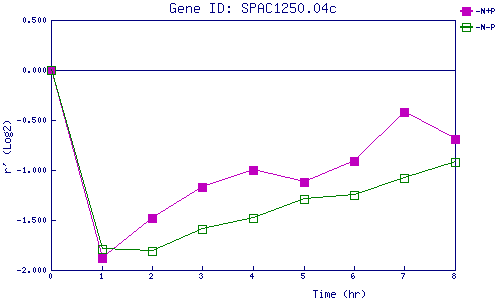
| 0 | 1 | 2 | 3 | 4 | 5 | 6 | 7 | 8 | |
| -N+P | 0.000 | -1.875 | -1.476 | -1.170 | -0.998 | -1.121 | -0.908 | -0.419 | -0.689 |
| -N-P | 0.000 | -1.793 | -1.814 | -1.588 | -1.478 | -1.294 | -1.253 | -1.083 | -0.922 |
|
-N+P: Nitrogen starved in the presence of P-factor -N-P: Nitrogen starved in the absence of P-factor |