sxa2
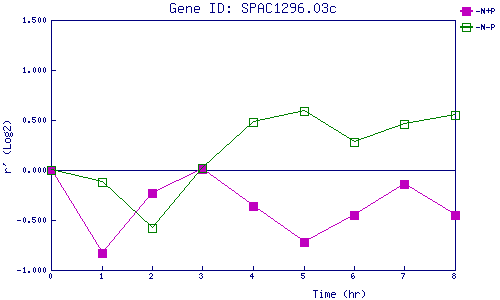
| 0 | 1 | 2 | 3 | 4 | 5 | 6 | 7 | 8 | |
| -N+P | 0.000 | -0.828 | -0.234 | 0.011 | -0.365 | -0.721 | -0.448 | -0.142 | -0.446 |
| -N-P | 0.000 | -0.123 | -0.581 | 0.017 | 0.477 | 0.589 | 0.278 | 0.461 | 0.553 |
|
-N+P: Nitrogen starved in the presence of P-factor -N-P: Nitrogen starved in the absence of P-factor |