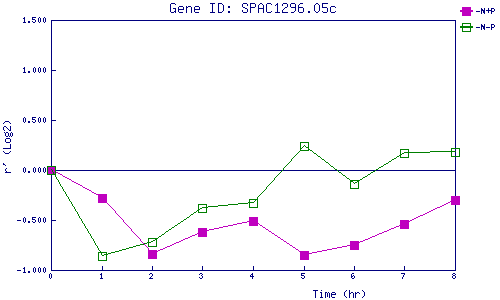
| 0 | 1 | 2 | 3 | 4 | 5 | 6 | 7 | 8 | |
| -N+P | 0.000 | -0.284 | -0.843 | -0.617 | -0.510 | -0.848 | -0.750 | -0.542 | -0.298 |
| -N-P | 0.000 | -0.860 | -0.718 | -0.378 | -0.326 | 0.241 | -0.138 | 0.174 | 0.185 |
|
-N+P: Nitrogen starved in the presence of P-factor -N-P: Nitrogen starved in the absence of P-factor |