| 0 | 1 | 2 | 3 | 4 | 5 | 6 | 7 | 8 | |
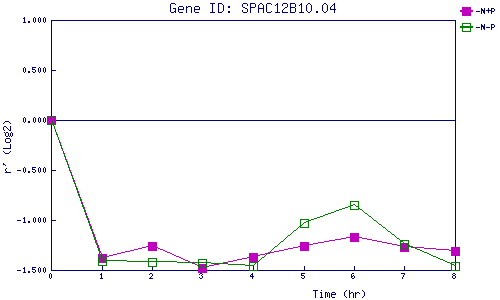
| -N+P | 0.000 | -1.377 | -1.258 | -1.485 | -1.374 | -1.262 | -1.169 | -1.273 | -1.307 |
| -N-P | 0.000 | -1.406 | -1.418 | -1.432 | -1.459 | -1.029 | -0.848 | -1.241 | -1.456 |
|
-N+P: Nitrogen starved in the presence of P-factor -N-P: Nitrogen starved in the absence of P-factor |