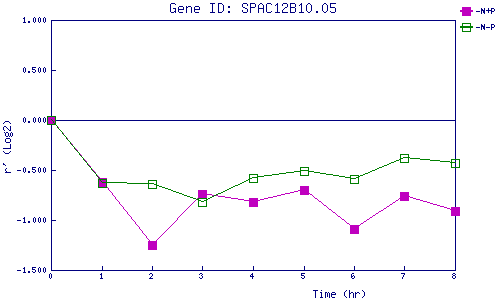
| 0 | 1 | 2 | 3 | 4 | 5 | 6 | 7 | 8 | |
| -N+P | 0.000 | -0.620 | -1.251 | -0.737 | -0.816 | -0.704 | -1.094 | -0.758 | -0.908 |
| -N-P | 0.000 | -0.630 | -0.640 | -0.818 | -0.578 | -0.506 | -0.587 | -0.385 | -0.430 |
|
-N+P: Nitrogen starved in the presence of P-factor -N-P: Nitrogen starved in the absence of P-factor |