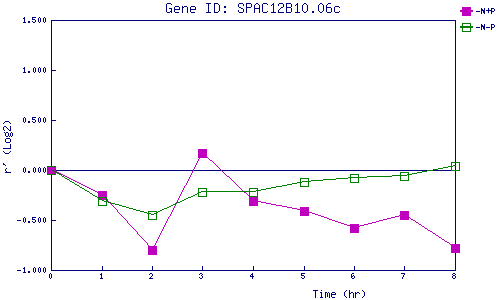
| 0 | 1 | 2 | 3 | 4 | 5 | 6 | 7 | 8 | |
| -N+P | 0.000 | -0.252 | -0.803 | 0.172 | -0.309 | -0.409 | -0.582 | -0.451 | -0.781 |
| -N-P | 0.000 | -0.308 | -0.449 | -0.216 | -0.218 | -0.119 | -0.085 | -0.062 | 0.042 |
|
-N+P: Nitrogen starved in the presence of P-factor -N-P: Nitrogen starved in the absence of P-factor |