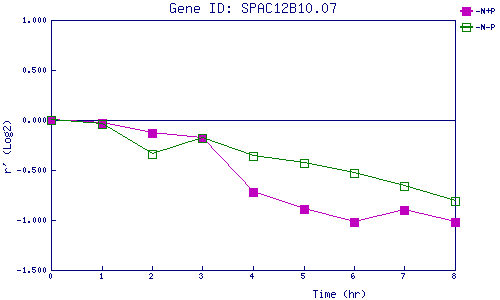
| 0 | 1 | 2 | 3 | 4 | 5 | 6 | 7 | 8 | |
| -N+P | 0.000 | -0.031 | -0.127 | -0.178 | -0.717 | -0.889 | -1.016 | -0.903 | -1.025 |
| -N-P | 0.000 | -0.036 | -0.340 | -0.180 | -0.356 | -0.431 | -0.533 | -0.659 | -0.807 |
|
-N+P: Nitrogen starved in the presence of P-factor -N-P: Nitrogen starved in the absence of P-factor |