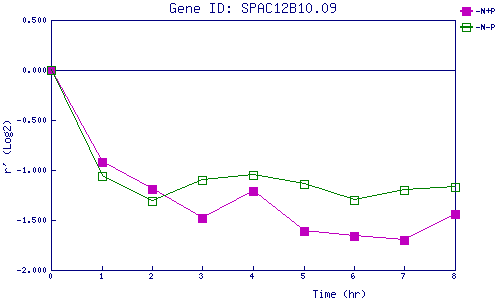
| 0 | 1 | 2 | 3 | 4 | 5 | 6 | 7 | 8 | |
| -N+P | 0.000 | -0.917 | -1.189 | -1.476 | -1.208 | -1.608 | -1.657 | -1.705 | -1.439 |
| -N-P | 0.000 | -1.064 | -1.306 | -1.095 | -1.051 | -1.135 | -1.300 | -1.195 | -1.172 |
|
-N+P: Nitrogen starved in the presence of P-factor -N-P: Nitrogen starved in the absence of P-factor |